Like Urban Research on Facebook

Showing posts with label Los Angeles. Show all posts

Saturday, May 10, 2025

Top 10 Cities with the Highest Car Ownership Rates and Their Struggles Against Car Dependency


Imagine cities where cars outnumber people, where the hum of engines defines the rhythm of life. These urban landscapes tell stories of sprawling highways, congested streets, and a culture deeply rooted in car dependency. But what shaped these cities, and how are they grappling with the consequences?


Introduction

Urban congestion isn’t just frustrating; it’s a sign of deeper urban planning challenges. From sprawling suburbs to car-centric policies, the cities with the highest car ownership rates reveal stories of economic growth, cultural trends, and transportation policies gone awry. Each city’s car dependency comes with unique consequences, from chronic traffic jams to innovative solutions to combat congestion.

In this video you find a ranking of ten cities with the highest car ownership rates. The cities in the ranking are only larger or international cities, while smaller cities have not been considered. The larger the car ownership rates are, the more dependent cars the cities are. The four elements of traffic status, transportation modal share, the causes of car dependency, and solutions and policies have been considered for all ten cities. Let’s look at the ranking together.


10. Tokyo, Japan: Urban Efficiency Amidst Ownership

Traffic Insights: Tokyo’s dense network of roads sees an average congestion level of 41%, with peak hours causing drivers to spend 46 minutes daily stuck in traffic.

Transportation Modal Share: Despite its 310 cars per 1,000 residents, Tokyo is a global leader in public transport usage. 85% of daily trips are made on trains, buses, and subways, powered by systems like the Yamanote Line, which moves 3.8 million passengers daily.

Causes of Car Dependency: Tokyo’s post-war economic boom transformed cars into status symbols. The sprawling Kanto region also relies on car ownership due to suburban expansion, though high parking fees and limited space deter excess use within the city core.

Solutions and Policies: Tokyo’s unique proof of parking requirement mandates that car buyers demonstrate ownership of a parking spot. Heavy investments in transit, including 12 Metro lines and 11 suburban railways, have created one of the most balanced mobility ecosystems globally.


9. Los Angeles, USA: Freeways to Gridlock

Traffic Insights: Los Angeles is synonymous with gridlock, with 62 hours annually lost to congestion per driver and an average commute time of 53 minutes.

Transportation Modal Share: With 640 cars per 1,000 residents, LA’s transit usage stands at just 6%, while 76% of residents commute by car—a stark contrast to its vibrant past as a rail-oriented city in the early 20th century.

Causes of Car Dependency: The post-war suburban boom and the infamous dismantling of the Pacific Electric Railway created a car-dominated urban sprawl. Housing policies and zoning laws further prioritized highways and single-family homes over dense, transit-friendly development.

Solutions and Policies: LA’s ongoing $88 billion Measure M initiative aims to reverse car dependency by expanding rail and bus networks. Projects like the Regional Connector Transit Project are set to integrate existing transit lines for seamless city-wide coverage.


8. Munich, Germany: Cars and Sustainability in Tandem

Traffic Insights: Munich experiences a moderate congestion rate of 27%, with peak delays adding up to 34 hours annually for drivers.

Transportation Modal Share: Although 580 cars per 1,000 residents are registered, over 70% of trips within Munich are made by bike, on foot, or via public transport. The S-Bahn and U-Bahn systems carry over 500 million passengers annually.

Causes of Car Dependency: Munich’s affluence, coupled with its automotive heritage as BMW’s headquarters, drives high car ownership. The city’s mixed-use development patterns, however, mitigate some of the typical effects of car dependency.

Solutions and Policies: Munich has invested heavily in its cycling infrastructure, with 300 kilometers of bike lanes and car-free zones in historic districts. Low-emission zones and incentives for electric vehicles are also reducing pollution from private cars.


7. Dubai, UAE: Cars as a Status Symbol

Traffic Insights: Dubai faces average congestion levels of 38%, with delays costing drivers 62 hours annually.

Transportation Modal Share: The city’s 540 cars per 1,000 residents contrast with its burgeoning public transit network. The Dubai Metro, spanning 75 kilometers, serves over 200 million riders annually, yet private car use dominates 80% of commutes.

Causes of Car Dependency: Rapid urbanization in the 1990s prioritized highways and car-centric infrastructure. Fuel subsidies and low vehicle import taxes further incentivized car ownership in this desert metropolis.

Solutions and Policies: Dubai has implemented toll systems like Salik and plans to expand metro and bus coverage under its 2040 Urban Master Plan. Recent initiatives also focus on creating walkable neighborhoods and integrating autonomous vehicles.


6. Kuala Lumpur, Malaysia: A City Stuck in Traffic

Traffic Insights: Kuala Lumpur has some of Southeast Asia’s worst congestion, with drivers spending 92 hours annually in traffic.

Transportation Modal Share: While 670 cars per 1,000 residents highlight car dominance, only 20% of daily trips are made on public transport despite significant investments in systems like the MRT and LRT.

Causes of Car Dependency: The city’s post-independence development favored suburban sprawl, with insufficient focus on integrated transit. Rising incomes during the 1990s further cemented car ownership as a symbol of success.

Solutions and Policies: The government’s Mass Rapid Transit project has added over 150 kilometers of rail since 2017. Future plans aim to increase the transit modal share to 40% by 2030.


5. Toronto, Canada: Gridlocked Suburbia

Traffic Insights: Toronto’s congestion ranks among North America’s worst, with drivers losing 142 hours annually to traffic delays.

Transportation Modal Share: With 740 cars per 1,000 residents, Toronto’s transit usage is at 23%, supported by systems like the TTC and GO Transit. However, 64% of residents rely on cars for commuting.

Causes of Car Dependency: Decades of suburban sprawl and car-centric infrastructure, combined with insufficient transit expansion, have created a heavy reliance on vehicles.

Solutions and Policies: Toronto’s SmartTrack project and expansion of the Eglinton Crosstown LRT aim to add over 75 kilometers of rail by 2030. Urban densification strategies are also being implemented to reduce reliance on private cars.


4. Singapore: Managing Cars with Precision

Traffic Insights: Singapore has remarkably low congestion levels for a dense city, with drivers spending just 50 hours annually in traffic.

Transportation Modal Share: With 390 cars per 1,000 residents, 80% of trips are made on public transit thanks to the efficient MRT and bus networks.

Causes of Car Dependency: While Singapore discourages excessive car ownership through its COE system, wealth and affluence still drive demand for luxury vehicles.

Solutions and Policies: Singapore’s world-class Land Transport Master Plan focuses on increasing rail capacity to 360 kilometers by 2040 and expanding bike-friendly zones. Toll systems like ERP further reduce road congestion.


3. Houston, USA: Freeways Over Freedom

Traffic Insights: Houston ranks among the most congested U.S. cities, with drivers losing 83 hours annually to gridlock.

Transportation Modal Share: With 850 cars per 1,000 residents, Houston’s transit ridership is just 6%, while 78% of commutes are car-based.

Causes of Car Dependency: Houston’s low-density zoning laws and emphasis on freeway expansion have made driving a necessity.

Solutions and Policies: The city is expanding its METRORail system and enhancing bike lanes, but its car-first culture poses significant challenges for change.


2. Perth, Australia: A Car-Dependent Outback

Traffic Insights: Perth’s congestion leads to 68 hours of annual delays per driver.

Transportation Modal Share: While 870 cars per 1,000 residents dominate, the city’s transit modal share is just 15%. Public systems like Transperth are underutilized due to sprawling suburban development.

Causes of Car Dependency: Perth’s geographic isolation and preference for low-density housing have historically favored cars.

Solutions and Policies: The Metronet project aims to double the rail network, focusing on connectivity and sustainable urban growth.


1. San Marino: Tiny Nation, Big Car Numbers

Traffic Insights: San Marino’s small size means minimal congestion, but narrow roads face frequent backups due to its high car density.

Transportation Modal Share: With 1,263 cars per 1,000 residents, public transport is virtually nonexistent, and cycling infrastructure is limited.

Causes of Car Dependency: Wealth, limited alternatives, and challenging terrain have cemented car ownership as a necessity.

Solutions and Policies: Discussions on electric shuttles and sustainable tourism initiatives aim to address some of these issues.


Conclusion

From Tokyo’s rail-heavy balance to Houston’s freeway dependence, these cities reflect the complex interplay between car ownership and urban planning. Addressing congestion, reducing emissions, and improving quality of life require bold, innovative approaches to transportation planning. The question remains: can we make cities less about cars and more about people?


More about urban transportation:

Which city built the first bike lane? A Tale of Bicycles, Cars, and Urban Revolution

Wednesday, December 11, 2024

Avoid the urban sprawl disaster that is coming

 Urban sprawl—two words that define the way many modern cities have grown, often at the expense of community, environment, and efficiency. Let’s dive into the origins of sprawl, its impact on our cities, and how some places are fighting back.


The Origins of Urban Sprawl

The story of urban sprawl starts in the mid-20th century, particularly in the United States. After World War II, a combination of economic prosperity, affordable cars, and the dream of owning a suburban home led to rapid expansion beyond city limits. This phenomenon is characterized by low-density, car-dependent development, with single-family homes and strip malls sprawling over vast distances.

But how did we get here? The Federal-Aid Highway Act of 1956 was a game-changer. It created 41,000 miles of interstate highways, making it easier than ever to commute long distances. In addition, the GI Bill provided low-interest home loans to millions of veterans, further fueling suburban growth.

However, this shift wasn’t just about convenience. There were also social factors at play, like “white flight,” where middle-class families moved to the suburbs, leaving behind urban centers that became increasingly segregated and underfunded.


Los Angeles: The King of Sprawl

When you think of urban sprawl, Los Angeles probably comes to mind. Spanning over 500 square miles, L.A. is the poster child for car culture. By the 1950s, the city had torn out its extensive streetcar network in favor of highways and freeways. As a result, today, Los Angeles has one of the highest car ownership rates in the world, with around 2.3 cars per household.

The impact? A study by the Urban Land Institute found that residents of sprawling cities like L.A. spend up to 30% more on transportation than those in more compact cities. The average Angeleno spends around 100 hours per year stuck in traffic, contributing to high stress levels and air pollution.

Furthermore, L.A.’s expansion has led to significant environmental consequences. The city consumes enormous amounts of water from sources like the Colorado River, depleting natural resources and impacting surrounding ecosystems. The sprawling development also contributes to the urban heat island effect, making the city 3-5°F warmer than its rural surroundings.


The Hidden Costs of Sprawl

Urban sprawl comes with hidden costs. For starters, infrastructure like roads, sewage, and electricity grids becomes more expensive to maintain over large, spread-out areas. According to the Congress for the New Urbanism, sprawl costs U.S. taxpayers $1 trillion annually due to inefficiencies in services.

Socially, sprawling cities can exacerbate inequality. With limited public transportation options, car ownership becomes a necessity, putting a strain on low-income families. In fact, 40% of low-income households in sprawling areas like Atlanta spend over 30% of their income on transportation alone.


Curitiba, Brazil: A Case Study in Smart Growth

But not all cities have fallen victim to sprawl. Curitiba, Brazil, offers a counter-narrative. Starting in the 1970s, visionary mayor Jaime Lerner implemented urban planning strategies that prioritized public transit and green spaces over car-centric development.

Curitiba’s Bus Rapid Transit (BRT) system became a model for sustainable urban planning. Today, over 70% of the city’s population uses the BRT, reducing traffic congestion and air pollution. By focusing on compact, mixed-use development, Curitiba has avoided the pitfalls of urban sprawl. As a result, the city boasts 16 parks and 14 forests, making it one of the greenest cities in Latin America.

Curitiba’s approach to urban planning has paid off. The city has a 25% lower car ownership rate compared to other Brazilian cities of similar size. Additionally, Curitiba’s residents enjoy a high quality of life, with 99% saying they are satisfied with their city’s public services.


The Future: Can We Reverse Sprawl?

With the challenges of climate change and resource depletion, many cities are reconsidering their development models. Portland, Oregon, for example, has implemented urban growth boundaries to limit sprawl, preserving over 25,000 acres of farmland and forest.

Similarly, Copenhagen aims to be carbon-neutral by 2025 by encouraging cycling and pedestrian-friendly spaces. Already, over 62% of Copenhagen’s residents commute by bike daily, drastically reducing the city’s carbon footprint.

Moreover, New York City’s recent initiatives to reclaim streets for pedestrians—like turning parts of Times Square into pedestrian-only zones—are a testament to the growing trend of prioritizing people over cars. These efforts are part of a larger movement towards “smart growth,” which focuses on sustainable, compact, and people-oriented development.


Conclusion

Urban sprawl has shaped our cities in profound ways, often with negative consequences for both people and the planet. However, cities like Curitiba and Copenhagen offer hope that a more sustainable, compact future is possible.

 More about urban sprawl:

Correlations of Urban Sprawl with Transport Patterns and Socioeconomics of University Students in Cracow, Poland

Monitoring Urban Sprawl and Sustainable Urban Development Using the Moran Index: A Case Study of Stellenbosch, South Africa

Sunday, November 24, 2024

Bikes vs. Cars: The Urban Battle

 Cities around the world have long been defined by how we choose to get around. For decades, cars have been the dominant force shaping urban landscapes, with highways, wide roads, and sprawling parking lots. But as we face growing concerns about climate change, pollution, and traffic congestion, there's been a push to rethink our reliance on cars. This has led to a battle between bikes and cars for the future of our cities. Let’s explore how two iconic cities, Amsterdam and Los Angeles, represent opposite sides of this urban struggle.


The Rise of Bike Culture: Amsterdam’s Success Story

Amsterdam is often seen as the gold standard for bike-friendly cities. But it wasn’t always this way. In the 1950s and 60s, Amsterdam, like many other cities, was moving towards a car-centric future. Cars flooded the streets, and cycling was in decline. However, a dramatic shift happened in the 1970s.

  • The Turning Point: The 1970s Oil Crisis and Protests
    By the early 1970s, the number of cars in the Netherlands had skyrocketed, and road safety was a major issue. In 1971 alone, over 3,000 people died in traffic accidents, including 400 children. This sparked widespread protests, with groups like “Stop de Kindermoord” (Stop the Child Murder) leading the charge for safer streets. The oil crisis of 1973 further fueled the shift, as fuel prices surged, prompting the government to promote cycling as a cost-effective alternative.
  • Biking Takes Over
    Thanks to grassroots activism and government support, Amsterdam invested heavily in cycling infrastructure. Today, 38% of all trips in Amsterdam are made by bike, and there are over 515 kilometers (320 miles) of bike lanes throughout the city. The city also boasts 881,000 bicycles, outnumbering its 821,000 residents. Cyclists are given priority on many roads, and car traffic is often restricted or slowed to accommodate them.
  • Economic and Environmental Impact
    Cycling in Amsterdam saves the city €19 million annually in health costs, thanks to reduced pollution and increased physical activity. Additionally, cycling has significantly lowered the city’s carbon footprint. In 2019, cycling in the Netherlands was estimated to prevent the emission of around 1.41 million tons of CO2 each year.
    That's the equivalent of taking 250,000 cars off the road.

Los Angeles: A Car-Dependent City’s Struggle to Embrace Bikes

While Amsterdam is a success story, Los Angeles represents the other side of the spectrum. Built with the car in mind, LA is known for its sprawling freeways and car culture. But as traffic congestion worsens and environmental concerns rise, the city is trying to make room for bikes.

  • A City Built for Cars
    Los Angeles has the highest car ownership rate in the U.S., with nearly 2.5 million cars registered in the city. The average Angeleno spends around 119 hours per year stuck in traffic, costing the city $9.3 billion in lost productivity annually. This car-centric infrastructure leaves little room for bikes, and as of 2023, only 1% of all trips in Los Angeles are made by bicycle.
  • Attempts at Change: The LA Bike Plan
    In recent years, Los Angeles has tried to reverse its dependence on cars. The 2010 LA Bike Plan aimed to add 1,684 miles of bikeways by 2035. However, progress has been slow. As of 2023, the city had built only 700 miles of bike lanes, often facing resistance from drivers and local businesses. For example, when the city installed bike lanes on Westwood Boulevard, it faced backlash from motorists concerned about losing parking spaces.
  • Mixed Results
    The push for more bike-friendly infrastructure in Los Angeles has led to some successes, such as the Expo Line Bike Path, which spans 12 miles and connects key neighborhoods. However, the city still struggles to match the bike infrastructure of cities like Amsterdam or even Portland, where 7% of all trips are made by bike.
  • Health and Environmental Benefits
    Despite the challenges, increasing bike use in LA could have huge benefits. If just 5% of all car trips were replaced with bike trips, the city could reduce CO2 emissions by over 2,000 tons annually. It would also help improve air quality in a city that often ranks among the worst in the U.S. for pollution.

Bikes vs. Cars: The Global Perspective

The battle between bikes and cars isn’t just limited to Amsterdam and Los Angeles. Cities around the world are grappling with this challenge.

  • Copenhagen, Denmark
    Often cited alongside Amsterdam as one of the world’s most bike-friendly cities, Copenhagen aims to be carbon-neutral by 2025. Currently, 62% of residents commute by bike daily, and the city has invested over €200 million in cycling infrastructure since 2005. The “Cycle Superhighways” project connects the city center with the suburbs, encouraging even more residents to cycle instead of drive.
  • Bogotá, Colombia
    Bogotá has implemented Ciclovía, where 120 kilometers of streets are closed to cars every Sunday, allowing cyclists, pedestrians, and skaters to take over. This initiative has inspired cities like New York and Mexico City to adopt similar programs. Bogotá also boasts over 550 kilometers of dedicated bike lanes, showing that bike culture can thrive even in car-dominated regions.
  • China
    In China, bike-sharing programs have exploded in popularity. Companies like Mobike and Ofo flooded cities with millions of bikes, resulting in 70 million daily bike trips at the peak of the trend. While the bike-sharing boom has since cooled, cities like Beijing and Shanghai are investing heavily in dedicated bike lanes to reduce car congestion.

Conclusion: The Road Ahead

The battle between bikes and cars is far from over. Cities around the world are recognizing the need to shift away from car dependency to more sustainable, healthier modes of transportation. Amsterdam shows us that with the right policies and infrastructure, a city can transform itself into a bike paradise. Meanwhile, Los Angeles demonstrates the challenges of retrofitting a car-centric city for bikes.

As we face the pressing issues of climate change, pollution, and urban congestion, the choice between bikes and cars becomes more than just a matter of preference—it’s a question of survival for our cities. The future of urban transportation may well depend on finding the right balance between these two modes, prioritizing sustainability, and designing cities that are not only efficient but also livable.

More about biking:

Logit and probit models explaining perceived cycling motives, barriers, and biking trip generation in Lahore, Pakistan

Tuesday, November 19, 2024

The Evolution of Streetlights: How They Shaped Our Cities

Streetlights are something we often take for granted, but their history is surprisingly fascinating. Not only have they transformed how we navigate cities after dark, but they've also influenced social behavior, urban planning, and even public safety. Let’s dive into the story of streetlights, from their humble beginnings to their energy-efficient future.


The Dark Ages: Early Street Lighting Efforts

Before the invention of modern streetlights, navigating a city after sunset was a risky endeavor. In ancient Rome, oil lamps were used to light up streets, but only the wealthiest neighborhoods could afford them. Similarly, in medieval Europe, cities were dimly lit by torches or bonfires, which were neither reliable nor safe.

But things began to change in the 16th century. In London, the first recorded streetlamps were introduced around 1417, with oil lamps becoming more common by the 1500s. It was a start, but the real breakthrough in street lighting was yet to come.

Paris: The “City of Light” is Born

One of the most significant milestones in street lighting history occurred in Paris during the 1800s. By the early 19th century, Parisian streets were known for their darkness and danger. In 1820, the city introduced gas streetlights, which were revolutionary at the time. The installation of 56,000 gas lamps transformed Paris, reducing crime rates and extending nightlife, which ultimately earned the city its famous nickname, “La Ville Lumière” or “City of Light.”

  • Quick Fact: By 1857, Paris had nearly 20,000 gas lamps, making it one of the first cities in the world to be comprehensively illuminated. This massive network of gas lamps didn't just light up streets—it also lit the way for other cities to follow suit.

Other major European cities quickly adopted this new technology. For instance, London and Berlin began installing gas streetlights, leading to a widespread transformation of urban nightlife and boosting the local economy by allowing shops and businesses to stay open longer.

The Electric Revolution: The Dawn of Light Bulbs

While gas streetlights were a significant improvement, they still required a lot of maintenance, including daily lighting and extinguishing. Enter the electric light bulb. Thomas Edison’s invention of the incandescent light bulb in 1879 sparked a new era in street lighting.

  • New York City
    New York City was one of the first places to adopt electric streetlights. In 1880, Brush arc lamps (an early form of electric street lighting) were installed on Broadway, leading to its iconic nickname, “The Great White Way.” By the early 1900s, most major cities in the United States had switched to electric streetlights, making streets safer and cities brighter.
  • Global Impact: By 1910, electric street lighting had become a global phenomenon, with cities like London, Berlin, and Tokyo installing electric streetlights en masse. This not only changed how people lived and worked but also drastically reduced crime rates in urban areas.

The LED Revolution: Lighting the Way to the Future

The most recent transformation in street lighting has come with the advent of LED technology. Light Emitting Diodes (LEDs) are significantly more energy-efficient than their incandescent and even fluorescent predecessors, lasting up to 25 times longer and using 75% less energy.

  • Los Angeles
    In 2009, Los Angeles began one of the largest LED streetlight retrofit projects in the world, replacing over 140,000 traditional streetlights with LED ones. The results were impressive: the city saved over $9 million in annual energy and maintenance costs and reduced its carbon footprint by about 47,000 metric tons per year.
  • Fun Fact: LEDs can be dimmed, controlled remotely, and even change colors for special occasions. For example, in San Francisco, LED streetlights can be adjusted for events like Pride Month or Earth Day, adding a layer of community engagement to urban lighting.

The Benefits of Modern Street Lighting

Modern streetlights do more than just brighten streets—they can actually shape the way cities function and grow. Here are some of the key benefits:

  1. Enhanced Safety: Studies show that well-lit streets can reduce crime by up to 20%. For instance, a study in Chicago found that installing additional streetlights in high-crime areas led to a 36% reduction in nighttime crime.
  2. Improved Traffic Flow: In cities like London, smart streetlights are equipped with sensors to monitor traffic flow and adjust lighting accordingly, reducing accidents and improving road safety.
  3. Energy Savings: Globally, street lighting accounts for about 6% of total energy consumption. By switching to LEDs, cities like Buenos Aires have cut energy use by more than 50%, saving millions in utility costs.

The Social Impact of Streetlights

Beyond safety and cost savings, streetlights have a profound social impact. In many developing countries, access to street lighting can transform communities by extending productive hours, improving women’s safety, and promoting local business activity.

  • Example: India
    In rural India, the installation of solar-powered streetlights in villages without reliable electricity has improved residents' quality of life, allowing children to study after dark and reducing the risk of nighttime accidents.
  • Fact Check: According to the United Nations, access to street lighting in developing regions has been linked to a 30% increase in women’s participation in evening markets and social events.

The Future of Streetlights: Smart Cities

As cities move towards becoming "smart cities," streetlights are playing a critical role. The next generation of streetlights will do more than just illuminate—they will be integrated with sensors and IoT (Internet of Things) technology.

  • Barcelona
    Barcelona has implemented smart streetlights equipped with sensors to monitor everything from air quality to noise levels. These smart lights can adjust their brightness based on pedestrian presence, which helps in reducing energy consumption by up to 30%.
  • The Bottom Line: The global smart street lighting market is expected to grow from $7.3 billion in 2021 to $13.4 billion by 2026, showing just how much potential there is in this technology.

Conclusion

From ancient oil lamps to smart LED streetlights, the evolution of street lighting has had a transformative impact on urban life. Streetlights have not only made cities safer and more vibrant but have also become symbols of progress and innovation. As technology continues to advance, who knows what the future holds? Maybe we'll see solar-powered, self-sustaining streetlights that also serve as Wi-Fi hotspots or even charge electric cars.

So the next time you walk down a brightly lit street, remember that you're experiencing the result of centuries of innovation. Streetlights are not just functional—they're a testament to human ingenuity, lighting the way to a brighter future.


Friday, April 7, 2017

REDUCING CRIME BY SHAPING THE BUILT ENVIRONMENT WITH ZONING: AN EMPIRICAL STUDY OF LOS ANGELES

By JAMES M. ANDERSON, JOHN M. MACDONALD, RICKY BLUTHENTHAL & J. SCOTT ASHWOOD

The idea of using law to change the built environment in ways that reduce opportunities to commit crimes has a long history. Unfortunately, this idea has received relatively little attention in the legal academy and only limited rigorous empirical scrutiny. In this Article, we review the considerable literature on the relationship between zoning, the built environment, and crime. We then report the results of two empirical studies on these relationships. First, we conducted a study of the effect of zoning on crime using 205 blocks selected in eight different relatively high crime neighborhoods in Los Angeles that have similar demographic characteristics but different forms of zoned land use. We find that mixed commercial- and residential-zoned areas are associated with lower crime than are commercial-only  zoned areas. Second, we matched neighborhoods undergoing zoning changes between 2006 and 2010 with neighborhoods that underwent no zoning changes during this period but had similar preexisting crime trajectories between 1994 and 2005. The primary zoning change in these neighborhoods was to convert parcels to residential uses. We find that neighborhoods in which there was a zoning change experienced a significant decline in crime. Our results suggest that mixing residential-only zoning into commercial blocks may be a promising means of reducing crime.


Crime

 more about built environment:

Urban Transformations of the Mediterranean Cities in Light of Developments in the Modern Era

Urban Sprawl: A view from developing and developed Countries

A THEORETICAL APPROACH TO CAPABILITIES OF THE TRADITIONAL URBAN FORM IN PROMOTING SUSTAINABLE TRANSPORTATION

Liveable Neighbourhoods: Street Layout, Design and Traffic Management Guidelines

Applying a CA-based model to explore land-use policy scenarios to contain sprawl in Thessaloniki, Greece

Friday, July 1, 2016

Smart Growth and Transit- Oriented Development at the State Level: Lessons from California, New Jersey, and Western Australia

By John L. Renne

The states of California, New Jersey, and Western Australia encourage smart growth through the employment of transit-oriented development (TOD). This article documents each state’s approach and highlights the importance of interagency cooperation at the state-level and intergovernmental cooperation between state and local governments. This article discusses the importance of state government participation in the planning and creation of policy to facilitate TOD and recommends elements for a model state TOD program.


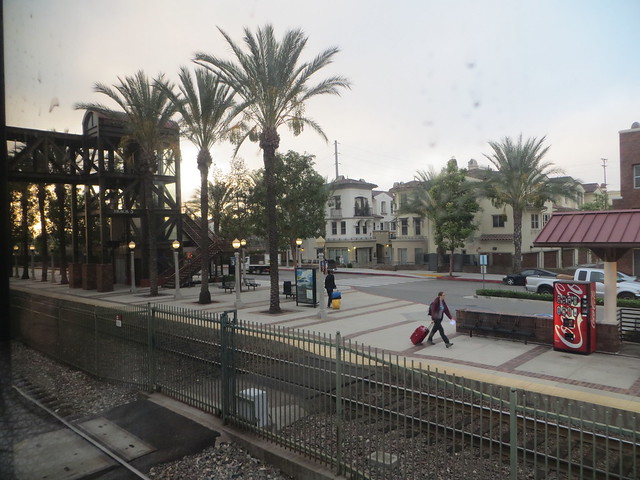
20140830 04 Fullerton, California

More about Transit-Oriented Development:

Employment decentralization and and Transit-Oriented Development

Seattle's first TOD

A Seattle development that is greener than green

‘Creating nature’ with an urban village in Seattle

Evaluating integration between public transportation and pedestrian-oriented urban spaces in two main metro stations of Tehran

Sunday, April 28, 2013

Green Alley Programs: Planning for a sustainable urban infrastructure?

by Joshua P. Newell, Mona Seymour, Thomas Yee, Jennifer Renteria, Travis Longcore, Jennifer R. Wolch, and Anne Shishkovsky


Revitalization of urban alleys, underway in cities and towns in North America, Europe, and other regions, can be seen as a manifestation of a broader movement among city agencies, planners, and community groups to expand green urban infrastructure and promote sustainability. This article analyzes alley greening programs in seven cities in the United States using the lens of sustainability planning. Study results indicate that most alley greening programs are narrowly oriented toward stormwater management. An in-depth exploration of the alley greening program in the city of Los Angeles illustrates how a more robust commitment to sustainability – through the adoption of goals related to environmental protection, economic development, and social equity – might be actualized in the context of alley greening efforts. The article also considers the role of collaboration in developing integrative sustainability programs around alleys.

more about sustainable city:

Tuesday, April 10, 2012

Los Angeles Streetcars: A Push To Bring Back The Rich History Of Streetcars Begins In Downtown LA

By ANDREW DALTON

Half a century after the last of the lost Pacific Electric Red Cars rumbled through Los Angeles, a move has begun to return streetcars to downtown LA.
With a route chosen by the city and an environmental review begun, the proposed four-mile Broadway-to-Figueroa loop is a modest project compared to the region's subway extensions and freeway expansions, but would provide a link between the key spots of the downtown renaissance and a symbolic link with the city's mythologized past.
Los Angeles once had a thousand miles of streetcar tracks.
Along them ran the Yellow Car Line and the more famed Red Cars, and since they gave way to freeways in the early 1960s they've become a symbol of the city's lost intimacy and identity, celebrated by politicians looking to restore transit glory and by films like "Who Framed Roger Rabbit."
While the streetcars of memory are invoked often – the city's soon-to-open Expo light rail line has Red Car tickets etched into the concrete at its final stop and city leaders on a recent test run shared memories of riding it – the proposed downtown project would be a far more direct restoration, starting with the route itself.
"Virtually every bit of this alignment is on streets that have historically had Red or Yellow car lines," said Robin Blair, director of planning for the Metropolitan Transit Authority.
While boosters are quick to point out that the new cars would be thoroughly modern, sleek and environmentally sound, nostalgia is their biggest emotional selling point.

Los Angeles, end of 5 line ine in Hawthorne, about 1939, photo by Metro Transportation Library and Archive

Broadway & Olympic 1940 Looking N from Los Angeles Railway headquarters building, by Metro Transportation Library and Archive

more about Los Angeles:

Grafitti photos, Los Angeles 1

good things about bikes. and some less good.

Different Sprawl Patterns in the U.S. Cities

Integration of landscape fragmentation analysis into regional planning: A statewide multi-scale case study from California, USA

Urban Design After Oil

The Invisible Cyclists: Immigrants and the Bike Community

Friday, October 7, 2011

Grafitti photos, Los Angeles 1

Grafitti in Los Angeles, by amayzun

Grafitti in Los Angeles, by amayzun

Grafitti in Los Angeles, by amayzun

Grafitti in Los Angeles, by amayzun

Grafitti in Los Angeles, by amayzun

Grafitti in Los Angeles, by amayzun

Grafitti in Los Angeles, by amayzun

Grafitti in Los Angeles, by amayzun

Grafitti in Los Angeles, by amayzun
more graffiti photos:

Grafitti photos, London 1

Grafitti photos, Amsterdam 1


Grafitti photos, Atlanta 1


Grafitti in Paris 1

Thursday, April 14, 2011

good things about bikes. and some less good.


A huge thanks to all of the volunteers working Saturday afternoon and into the evening. If you (faceless readers) haven’t yet been by to check out their space, please make an effort to do so. It’s open, well-lit, welcoming, and all of the volunteers who were helping out on Saturday afternoon were in good spirits (in spite of constantly being called to and fro).
Less awesome: The bike I was working on. I brought in an absolute clunker of a bike – an old Motobecane that had been sitting outside under the porch in Colorado for far too long and had then made the trip to California and spent most of its time sitting in our hallway. Less than awesome. There’s progress on the beast, and it was almost (briefly) rideable. But when I brought it home and inflated the tire a little more, I realized there was a slight issue. If the tire was inflated to the recommended psi (say, about 80), it bulged out seriously on the sidewall, so much so that it wouldn’t spin through the brakes. So I deflated the tire, tried to reseat the bead in the rim, then inflated the tire again.
 

more about Los Angeles:

Friday, March 18, 2011

PhD in urban planning in UCLA, School of Public Affairs

Introduction
 
The Department of Urban Planning at UCLA is famous for producing outstanding planning scholars and teachers through its distinct mix of three program elements: top faculty in critical fields, a flexible curriculum, and superb opportunities for important and progressive research. Applicants to the Ph.D. program must have a Master's degree in planning or a closely related field.

Faculty
 
Our faculty is composed of nationally and internationally well-known scholars and teachers. Their expertise spans community development, critical studies, gender studies, labor studies, economic development, housing, international planning, transportation planning, political economy, the natural environment, culture and ethnicity, and urban design. (See "research areas" section).
UCLA is one of the leading research institutions in the world. The size and quality of the university's research network is exceptionally strong and offers considerable additional faculty resources to our graduate student body. The Department's resources go well beyond its faculty to include many other units on campus. Members of the faculty share appointments with the College of Letters and Science, the Institute of the Environment, the School of Public Health, the School of Arts and Architecture, the Center for Latin American Studies, the Center for Asian American Studies, the Center for Urban Poverty, and the Institute of Labor Relations, as well as -- within the School of Public Policy & Social Research -- the Policy Studies and Social Welfare Departments, the Institute for Transportation Studies, the Institute of Labor and Employment, and the Lewis Center for Regional Studies.

Curriculum
 
Our doctoral program is distinctively intimate and flexible. The course and research requirements build skills and provide research experience through close faculty-student interaction. Each entering Ph.D. class is small, and each student is sponsored and supervised by two faculty members. Flexibility is the cornerstone. While faculty contact and advising is important, we also believe that strong students benefit from designing the research path that best suits their interests. 


UCLA campus, photo by ATIS547
more urban planning programs:

Urban and Regional Planning Programs, Courses, Schools and Degrees in Ontario Universities

GIS in U.S. Urban Studies and Planning Education

Focus on Regional and Urban Planning