Like Urban Research on Facebook

Showing posts with label California. Show all posts

Saturday, April 19, 2025

Which city built the first bike lane? A Tale of Bicycles, Cars, and Urban Revolution

 Where and when was the first bike lane built? Maybe this is the question you’ve asked yourself and thought there should be a straightforward answer. Here are some of the facts about the first city in which the first bike lane was built.

Imagine a time when streets buzzed not with honking horns but with the soothing whir of bicycle wheels. Then, the industrial roar of cars took over, transforming cities forever. But as traffic jams grew unbearable, the bicycle staged a quiet comeback, demanding its rightful place on the asphalt. This is the story of the first urban bike lanes—or rather, the mystery of where they truly began.


The Invention of the Bicycle and the Car

The bicycle’s journey began in 1817, when Karl von Drais, a German inventor, created the “Draisine,” a precursor to the modern bike. This two-wheeled contraption revolutionized personal transport, offering an alternative to horse-drawn carriages. By the late 19th century, with innovations like the pedal-powered “Boneshaker” and later the Penny Farthing, bicycles became a staple of urban mobility.

At the same time, industrial revolutions across Europe and the United States were reshaping cities. Factories boomed, and the need for faster, mechanized transport spurred the invention of the automobile. In 1886, Karl Benz introduced the world’s first motorcar. By the 1920s, Henry Ford’s assembly line had made cars affordable, flooding cities with motorized traffic. The automobile wasn’t just a vehicle—it was a status symbol, a marker of modernity.

The Rise of Cars and the Downfall of Bicycles

As cars became ubiquitous, bicycles were pushed to the margins. In America and Europe, streets were redesigned to prioritize automobiles. By the mid-20th century, cities like Los Angeles epitomized car-centric planning, with sprawling freeways and scant attention to cyclists. Traffic congestion soared, but the love affair with cars persisted.

In the wake of World War II, urban planners increasingly realized the cost of car dependency: clogged streets, smog-filled skies, and diminished quality of life. Cycling advocates began pushing back, arguing for dedicated spaces for bicycles in cities overwhelmed by automobiles. This resistance laid the foundation for the bike lanes we see today.

The Mystery of the First Urban Bike Lane

The story of the first urban bike lane is far from straightforward. Multiple cities across the globe claim the title, each offering a compelling narrative.

Davis, California, 1967: A Pioneer of Bike Infrastructure

In the 1960s, Davis, California—a small university town—faced rising car traffic and growing concerns about cyclist safety. In 1967, the city implemented one of the first bike lanes in the United States, complete with dedicated paths separated from motorized traffic. Davis’s efforts were groundbreaking, earning it the title of “Bike Capital of America.” Today, Davis boasts over 100 miles of bike paths, a testament to its early commitment to cycling infrastructure.

Copenhagen, Denmark: A Legacy from the 1920s

Long before Davis, Copenhagen had begun experimenting with dedicated bike paths. By the 1920s, the Danish capital had created some of the earliest cycling lanes in Europe. These paths were rudimentary by today’s standards, but they marked a significant shift in urban planning. Copenhagen’s cycling culture only grew stronger over the decades, and today, over 62% of residents commute by bike.

London, UK: The Forgotten Victorian Paths

Surprisingly, some of the earliest bike lanes might date back to Victorian-era London. In the late 19th century, cycling clubs lobbied for smoother roads and safe spaces for their members. While these were not formal “lanes,” they laid the groundwork for later developments. By the early 20th century, London had begun experimenting with designated bike paths, though these efforts were overshadowed by the city’s rapid motorization.

Amsterdam, Netherlands: A Grassroots Revolution

In the 1970s, Amsterdam faced a crisis. Rising car traffic had led to a spike in road fatalities, including many children. Outrage sparked the Stop de Kindermoord (Stop the Child Murder) movement, which pressured the government to prioritize cycling. By the end of the decade, Amsterdam had established a vast network of bike lanes, transforming it into a cyclist’s paradise. While not the “first” bike lanes, Amsterdam’s infrastructure became a model for cities worldwide.

The Debate: Who Deserves the Title?

The question of the “first” bike lane is tricky. Davis, California, was undoubtedly a pioneer in the modern sense, with well-delineated paths and citywide planning. Yet Copenhagen and Amsterdam had laid the groundwork decades earlier, fostering a cycling culture that would later inspire global movements.

In contrast, Victorian-era London reminds us that the concept of bike lanes isn’t new—it’s a rediscovery of older ideas adapted for modern cities. Each claim to the “first bike lane” reveals how different cities approached cycling at various points in history, reflecting their unique urban challenges.

The Legacy of Early Bike Lanes

Regardless of where they began, early bike lanes sparked a revolution in urban planning. Today, cities like Berlin are experimenting with bicycle-priority streets, while Bogotá’s CiclovĂ­a closes entire roads to cars on Sundays, allowing cyclists to take over. The early pioneers showed that cycling isn’t just a mode of transport—it’s a way to reclaim cities for people, not machines.

Conclusion: A Shared Triumph

The search for the “first bike lane” may never yield a definitive answer. But perhaps the debate misses the point. What matters isn’t who came first—it’s the collective shift toward making cities more livable, sustainable, and inclusive. From Davis’s 1967 experiment to Copenhagen’s cycling utopia, each city contributes a piece to the puzzle, proving that bikes belong in urban landscapes.

Who knows? Maybe the next breakthrough in cycling infrastructure is happening right now, in a city yet to make headlines.
 More about bicycle planning:

Active Transport in Egypt: The Cairo Bike Project

Bikes vs. Cars: The Urban Battle


Friday, July 1, 2016

Smart Growth and Transit- Oriented Development at the State Level: Lessons from California, New Jersey, and Western Australia

By John L. Renne

The states of California, New Jersey, and Western Australia encourage smart growth through the employment of transit-oriented development (TOD). This article documents each state’s approach and highlights the importance of interagency cooperation at the state-level and intergovernmental cooperation between state and local governments. This article discusses the importance of state government participation in the planning and creation of policy to facilitate TOD and recommends elements for a model state TOD program.


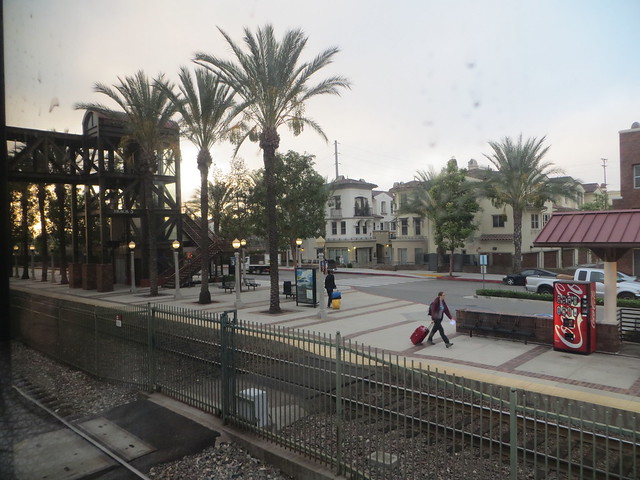
20140830 04 Fullerton, California

More about Transit-Oriented Development:

Employment decentralization and and Transit-Oriented Development

Seattle's first TOD

A Seattle development that is greener than green

‘Creating nature’ with an urban village in Seattle

Evaluating integration between public transportation and pedestrian-oriented urban spaces in two main metro stations of Tehran

Saturday, May 18, 2013

How the Built Environment Influences Non-Work Travel: Theoretical and Empirical Essays

by Daniel Gregory Chatman

Characteristics of the built environment include the arrangement of land uses, transportation infrastructure, and neighborhood design. Built environment policies are hypothesized to influence congestion- and pollution-causing auto use by affecting the convenience of travel by different modes. But after decades of empirical research measuring the strength of built environment influences on travel, theories remain poorly articulated and empirical research contradictory.
In the first essay, I argue that the built environment can be expected to influence the quality, quantity and price of traveling to out-of-home activities. Travel choices depend crucially on how the built environment simultaneously affects characteristics of travel by all modes. The proposed theoretical framework provides a means of organizing common hypotheses about the built environment and travel, leading to an increased understanding of interrelationships, better interpretations of existing studies, and improved empirical strategies for future research.
The second essay is an empirical study on how development density influences out-of-home non-work activity participation and auto use, using data from a survey that I carried out in San Diego and the San Francisco Bay Area from November 2003 to April 2004. Density’s most significant influences are not on the ease of reaching activities on foot or via transit, but on the difficulty of using the auto and, to a lesser extent, on the quality of walking. Previous contradictory empirical findings likely suffer from omitted variable bias.
The third essay investigates the hypothesis that densely-developed neighborhoods with walking access to retail shops, good transit service, and finely-meshed street grids attract households who prefer to walk and take transit. If so, observed relationships between the built environment and travel may reflect a residential sorting process rather than an exogenous effect of the built environment on travel. I theorize that residential self-selection is imperfect with respect to non-work accessibility, and show that accounting for pre-existing travel-related preferences increases the explanatory power of statistical models but reveals relatively little bias in conventional analysis.


more about travel behavior research:

Tuesday, April 10, 2012

Los Angeles Streetcars: A Push To Bring Back The Rich History Of Streetcars Begins In Downtown LA

By ANDREW DALTON

Half a century after the last of the lost Pacific Electric Red Cars rumbled through Los Angeles, a move has begun to return streetcars to downtown LA.
With a route chosen by the city and an environmental review begun, the proposed four-mile Broadway-to-Figueroa loop is a modest project compared to the region's subway extensions and freeway expansions, but would provide a link between the key spots of the downtown renaissance and a symbolic link with the city's mythologized past.
Los Angeles once had a thousand miles of streetcar tracks.
Along them ran the Yellow Car Line and the more famed Red Cars, and since they gave way to freeways in the early 1960s they've become a symbol of the city's lost intimacy and identity, celebrated by politicians looking to restore transit glory and by films like "Who Framed Roger Rabbit."
While the streetcars of memory are invoked often – the city's soon-to-open Expo light rail line has Red Car tickets etched into the concrete at its final stop and city leaders on a recent test run shared memories of riding it – the proposed downtown project would be a far more direct restoration, starting with the route itself.
"Virtually every bit of this alignment is on streets that have historically had Red or Yellow car lines," said Robin Blair, director of planning for the Metropolitan Transit Authority.
While boosters are quick to point out that the new cars would be thoroughly modern, sleek and environmentally sound, nostalgia is their biggest emotional selling point.

Los Angeles, end of 5 line ine in Hawthorne, about 1939, photo by Metro Transportation Library and Archive

Broadway & Olympic 1940 Looking N from Los Angeles Railway headquarters building, by Metro Transportation Library and Archive

more about Los Angeles:

Grafitti photos, Los Angeles 1

good things about bikes. and some less good.

Different Sprawl Patterns in the U.S. Cities

Integration of landscape fragmentation analysis into regional planning: A statewide multi-scale case study from California, USA

Urban Design After Oil

The Invisible Cyclists: Immigrants and the Bike Community

Friday, February 24, 2012

Road Safety in the Context of Urban Development in Sweden and California

by Carolyn Ann McAndrews

Road safety is a serious public health issue throughout the world, with more than one million people killed in traffic accidents each year. Despite the severity of its health impacts, the World Health Organization says that traffic safety is a "neglected" topic. Perhaps this is the case in the US, where traffic accidents are the leading cause of death for people up to age 34, and where the traffic safety record is one of the worst among high-income countries. Other highincome countries such as Sweden have much better road safety performance.
Differences in road safety between countries could be explained by the quality of infrastructure, driving conditions, the culture of driving, or the power of enforcement. Each of these elements is shaped by institutional contexts such as design, planning, and policy-making processes. Moreover, research about other technical systems has shown the powerful effect of organization, norms, and communication on safety. This led me to ask: How do our cultural and professional interpretations of safety influence the way we plan, design, and manage streets? Based on field studies, statistical analysis of crash and injury data, and interviews with practitioners, I found that professionals in California and Sweden share similar ideas about road safety, such as the roles of driver behavior, the road environment, and the vehicle in producing hazards. Professionals in both cases also face similar conflicts in road safety planning, such as whether to provide greater mobility for cars, or to reduce the speed of traffic to prevent injury. These similarities reflect shared professional and disciplinary backgrounds and sources of information, as well as similarities in the issues that municipalities and regions face. The main differences are in the interaction between road safety ideas and larger institutional contexts such as suburban land development. For instance, in the middle of the 20th century, Sweden created a multi-modal transportation system that accommodated cars as well as transit, pedestrians, and bicyclists—even in the suburbs. A combination of architects, city planners, and transportation engineers supported this development. Multi-disciplinary policy communities in Sweden found traction for their safety-oriented designs in the relatively integrated transportation and land use planning system. In the US, such integration was not the norm, and efforts to use design and land use controls to create a safe transportation system often meet resistance from the established institutions of the car-oriented road transportation system. Improving road safety in California and the US requires addressing not only the dominance of automobiles, but also recognizing that sectors outside of, but related to transportation, such as housing, public health, and land use planning, need to be key participants in creating a safe road transportation system.

San Francisco Traffic Survey: Fatalities & Personal Injuries (1937), by Eric Fischer


more about urban transportaiton:

Traffic safety and city structure: lessons for the future

Commuter Commotion: 6 Futuristic Mass Transit Concepts

The Effects of Land Use on the Mobility of Elderly and Disabled and Their Homecare Workers, and the Effects of Care on Client Mobility: Findings from Contra Costa, California

Understanding the Impact of Transportation on Economic Development

TRAVEL DEMAND FORECASTING FOR URBAN TRANSPORTATION PLANNING

Tuesday, February 21, 2012

TRANSFORMING AUTO-CENTRIC COMMUNITIES INTO WALKABLE NEIGHBORHOODS: WALKABILITY AUDITS OF TWO NEIGHBORHOODS IN SAN JOSÉ

by George D. Schroeder

Walkable neighborhoods are becoming increasingly desirable for both local governments and residential communities. Walkable neighborhoods have healthier residents, higher levels of social capital, higher property values, and environmentally friendly qualities.1 Nonetheless, 60 percent of the U.S. population does not get the recommended 30 minutes of physical activity each day, contributing to higher rates of obesity and other serious health problems such as heart disease.2 Additionally, over 90 percent of travel trips one to two miles in length are made by private automobiles.3 Public interest and advocacy from the urban planning and public health disciplines are bringing attention to the need to improve walkability in American cities.
It is widely known throughout the planning field that post-World War II U.S. urban and suburban development centered on automobile accessibility at the expense of other transportation modes.4 San José, California, is a classic example of a city that largely developed during the automobile age, leaving behind a legacy of mid-20th century planning policies and an auto-centric environment. A key question for planners, public officials, and researchers is how to reverse this legacy and transform these communities into active, pedestrian-friendly cities.
This research utilizes a modified version of Clifton et al.’s Pedestrian Environment Data Scan (PEDS) instrument,5 referred to simply as the Walkability Audit Instrument (WAI) to audit the walkability of two San JosĂ© neighborhoods with contrasting urban form patterns. The Five Wounds/Brookwood Terrace (FWBT) neighborhood contains compact, rectilinear pre-World War II development and the West Evergreen (WE) neighborhood consists of sprawling, post-World War II suburban development.
This research project is one of few to apply the PEDS instrument in a practical setting. Results from this research will be of interest to planning practitioners, public health officials, and researchers across the U.S. facing similar questions of how to reconfigure their auto-centric neighborhoods into walkable communities.
There are three main objectives for this project:
1. Provide an example of the effect of urban form on walkability in San José
2. Provide fine-grained pedestrian environment data for each public street segment in the FWBT and WE neighborhoods
3. Provide recommendations to improve walkability in the subject neighborhoods which can also be applied to other San José neighborhoods.
This report consists of eight chapters. Chapter 1 introduces the project, its methodology, and explains its relevance. Chapter 2 analyzes literature on the built environment’s effect on walking. Chapter 3 reviews current literature on walkability audits. Chapter 4 reviews the City of San JosĂ©’s and respective neighborhoods’ major planning documents related to pedestrians. Chapter 5 provides more background on the two neighborhoods and discusses current walkability concerns. Chapter 6 provides an overview of PEDS, the WAI, and the methodology used in the audit. Chapter 7 details the audit findings and recommendations, and Chapter 8 concludes the report.
There are four appendices at the end of the report. Appendix A explains the dynamics and administration protocol for each item of the WAI. Appendix B lists each street segment that was audited, its numeric score, and rating. Appendix C shows detailed audit result tables broken down by each item of the WAI. Appendix D identifies street segments and intersections that lack sidewalks and provisions for Americans with Disabilities Act (ADA) accessibility.


more about walkability:

Validating walkability indices: How do different households respond to the walkability of their neighbourhood?

Steps Forward: Review and Recommendations for Research on Walkability, Physical Activity and Cardiovascular Health

Environmental Correlates of Walking and Cycling: Findings From the Transportation, Urban Design, and Planning Literatures

Accessibility Measures: Overview and Practical Applications

Thursday, February 16, 2012

The Effects of Land Use on the Mobility of Elderly and Disabled and Their Homecare Workers, and the Effects of Care on Client Mobility: Findings from Contra Costa, California

by Anne Orelind Decker

This study looks at the relationships among land use; the mobility of disabled and elderly recipients of public home healthcare; the mobility of their homecare workers; and how much care those homecare workers provide. The findings are based on nearly 1,300 survey responses from clients and homecare workers in the In-Home Supportive Services (IHSS) program in Contra Costa County, California, a publicly funded program for individuals with disabilities who have low incomes. The homecare workers I surveyed belong to the Service Employees International Union (SEIU). The qualitative data and descriptive statistics paint a portrait of both populations' transportation habits and challenges. Regression analyses, controlling for variables such as car ownership, disability level, gender, age, and race, tested the interactions between the variables of interest in six hypotheses.
The results are complex and occasionally conflicting, yet patterns appear. For example, the IHSS clients have car-use rates far lower than average, with only 10% driving themselves when they leave home, and almost half live alone; these facts, combined with their low incomes and disabilities, mean that IHSS clients are sensitive to how much transportation assistance they receive in terms of how often they leave home and what destinations they are able to reach. They also respond to land use characteristics, especially when measured at the neighborhood scale, with those living in higher density and accessibility areas generally experiencing greater mobility. The homecare workers similarly have low incomes and use alternative modes of transportation more often than do Contra Costa commuters on average. Unlike their clients, homecare workers living in higher density and accessibility areas generally experienced increased travel challenges. But living closer to their clients was associated with being able to provide more effective care, as was having an easier commute measured by other variables. The more care provided, the greater mobility their clients experienced.
The populations of care recipients and professional homecare workers are growing as, among other trends, the proportion of senior citizens increases and families disperse across the country or world. Understanding mobility barriers as well as ways to facilitate efficient and effective care provision becomes all the more important. This study describes transportation problems that IHSS clients and caregivers encounter and points to certain possible responses, in particular expanding the transportation assistance that caregivers are able to provide.


more about land use:

URBAN CHANGE MONITORING USING GIS AND REMOTE SENSING TOOLS IN KATHMANDU VALLEY (NEPAL)

IMPACTS OF URBANIZATION ON ENVIRONMENTAL RESOURCES: A LAND USE PLANNING PERSPECTIVE

Sustainability: A Vital Concept for Transportation Planning and Development

Halting Urban Sprawl: Smart Growth in Vancouver and Seattle

Challenges to Urban Transport Sustainability and Smart Transport in a Tourist City: The Gold Coast, Australia

Wednesday, January 25, 2012

Remote Sensing and Urban Growth Models – Demands and Perspectives

by Martin Herold, Gunter Menz and Keith C. Clarke

Urban growth and land use change models are an important and innovative tool that support planning and development of sustainable urban areas. The data requirements for parameterization, calibration and validation of urban models are intense due to the complexity of the models and their objectives. In this study several urban land use change models are evaluated and their demands on spatial data sets are compared. These needs are discussed and evaluated based on the use of remotely-sensed high spatial and temporal resolution data. The results show especially the need for accurate urban land use information due to the Level II and III of the USGS/Anderson land cover/use classification scheme. An appropriate methodology for urban land use differentiation using high resolution remotely sensed data is presented and evaluated in test sites in the southern California city of Santa Barbara, USA. The approach is based on irregularly-shaped regions of homogenous urban land use as the defined mapping units. Within these regions, spatial and fractal metrics were applied to describe the land cover structure, to acquire urban land use information and to describe socioeconomic features.
The application of one of the evaluated urban growth models is presented, based on a seventy-year time series of air photos. The urban growth process, as well as future predictions of land use change are well represented in the model based upon the concept of cellular automata and demonstrate the potential of a combined remote sensing and modeling approach.


more about remote sensing:

Remote Sensing and Urban Growth Models – Demands and Perspectives

APPLICATION OF REMOTE SENSING AND GIS TECHNIQUE FOR EFFICIENT URBAN PLANNING IN INDIA

GIS in U.S. Urban Studies and Planning Education

EVACUATION PLANNING IN EARTHQUAKE DISASTERS, USING RS & GIS

Remote Sensing and Urban Growth Models – Demands and Perspectives

Tuesday, January 3, 2012

The House that Shaped an Architectural Generation: Frank Gehry’s First ‘Deconstructivist’ Building


What happened to Frank Gehry? Some call it a midlife crises, others chalk it up to a moment of revelation. Whatever occurred, this rather conventional middle-aged architect changed virtually overnight into an avante garde designer and created what is arguably the most influential residence of the 20th Century. Deconstructivism now pervades the field of architecture and has influenced virtually every contemporary all-star architect in the world. Gehry is perhaps best known for his curvy, metalic wave-form museums in Bilbao, Seattle, Los Angeles and Minneapolis, but it all started with strange impulses applied to his own traditional little Santa Monica house in the late 1970s.
Frank Gehry’s house in Santa Monica came before its time as a harbinger of the Deconstructivist movement. The first recognizedpublic Deconconstructivist architectural project came almost a decade later. Gehry took his seemingly ordinary house in Santa Monica and began changing things incredibly strange ways. He took a step beyond the playful reworkings of Postmodern architecture, where traditional design symbols were reinterpreted, and instead starting using materials and strategies few applied to architectural projects.

Frank Gehry's house in Santa Monica, California, photo by IK's World Trip

Frank Gehry's house in Santa Monica, California, photo by Kristo

Frank Gehry's house in Santa Monica, California, photo by IK's World Trip

Frank Gehry's house in Santa Monica, California, photo by IK's World Trip

more about architecture:

How many qualified Chinese landscape architects are there? – and how many does China need?

City Beautiful movement

Architecture & Urban Planning in China: urbanization to create massive infrastructure investment

Harmony at the Guangzhou Opera House by Zaha Hadid

A Very San Franciscan Transit Center

Tuesday, December 27, 2011

A missed opportunity, and the shortcomings of regional planning


Gearing up to prepare the next update to the Regional Transportation Plan (RTP), the Metropolitan Transportation Commission (MTC) has been evaluating a new policy framework to determine when a transportation project is considered to be a regional commitment.  Projects that are committed will be included in the next RTP.  Projects that are not committed could be included, but they would first be subject to a benefit-cost analysis and would have to be approved separately by the Commission.
At what point is a project far enough along in the process to be “committed”?  We looked before at the two policy choices that were being considered.  There is more detail in that previous post, but the brief recap is that with “Option 1,” a project is committed if it has been environmentally cleared, e.g. the project has an EIR certified under the California Environmental Quality Act (CEQA).  With “Option 2,” a project is not committed until dirt has turned and construction is underway.  Of these two options, I supported Option 2 because it would expose commissioners to a benefit-cost analysis for more projects, thereby empowering them with greater discretion to decide whether even older projects are still worthy of pursuit.  The Planning Committee also supported Option 2 and voted to move it forward to the full Commission.


more about regional planning:

Governance of Tehran City - Region: Challenges and Trends

Research Methods in Urban and Regional Planning

Integration of landscape fragmentation analysis into regional planning: A statewide multi-scale case study from California, USA

Regional Development in the Philippines: A Review of Experience, State of the Art and Agenda for Research and Action

Wednesday, November 16, 2011

Ph.D. Program in Planning, Policy, and Design, University of California, Irvine

Today's complex urban, social and environmental issues can best be understood by researchers who can work across disciplinary boundaries, and who understand the relationship of research to action. The planning, policy, and design (PPD) doctoral program at the University of California, Irvine trains scholars for national and international prominence in the analysis of social problems related to the built, natural and institutional environments. Our faculty members and students combine perspectives from urban planning, public policy, and design behavior. The planning, policy, and design Ph.D. is based on the department's internationally prominent research and teaching strengths, including design-behavior research, environmental policy, health promotion and policy, and urban and community development.
Students in the Ph.D. program take a common core of classes, then specialize in study related to their research interests. Students may design their own specialization or may follow the guidelines provided to specialize in Policy and/or Urban and Regional Planning. In either case, the elective courses need to be approved by the student’s faculty advisory committee.


more programs in urban planning and design:

The 10 Best Graduate Programs In Urban And Regional Planning

Urban Planning Master's Program in Rutgers University

PhD in Urban and Public Affairs, University of Louisville

PhD in City & Regional Planning in Georgia Tech


PhD of urban planning in The University of Melbourne, Melbourne School of Design (MSD)


Thursday, November 3, 2011

California’s Policy Model to Reduce Oil Use and Vehicle Emissions


Despite having continual governing issues, budget problems and high employment, California has been a leader in developing policy to address climate change. Dan Sperling, discussing California’s leadership in vehicle emissions standards at the Carnegie Endowment for International Peace at an event held on Monday, spoke about his joint report with Mary Nichols, titled, “California’s Policy Model for Reducing Oil Use and Emissions from Transportation.”
The report discusses the suite of policies, developed without federal or international mandate, which can serve as a model for other governments. The policies address three areas: vehicles, fuels, and travel demand. Sperling notes that whereas vehicle technology will likely be the largest contributor to reductions in transportation emissions in the developed world, travel demand in China will have the greatest impact on its transportation emissions.
California, having the original, iconic car-oriented lifestyle, adopted vehicle emissions standards as early as the 1960s to reduce air pollution. Since then, the state has been at a unique crossroads allowing the progression of GHG policy.
 

more about CO2 emissions in urban environments:


Wednesday, October 26, 2011

Skyline photos of San Diego, California

skyline photo of SAn Diego, by The Brit_2

San Diego skyline, by SD Dirk

San Diego skyline, by _Wiedz

San Diego skyline, photo by liquoredonlife

San Diego skyline, by Tomcio77

San Diego skyline,by (Adam) THEO

skyline photo of SAn Diego, by The Brit_2

skyline images of San Diego, by jarnott

skyline photo of SAn Diego, by The Brit_2

San Diego skyline, by vrysxy
more skyline photos:

Skyline photos of Marseille, France

Photos of Delhi skyline

Skyline photos of Hamburg, Germany 1

Skyline photos of Portland, Oregon 1

Sunday, October 9, 2011

Neighborhood Design and the Accessibility of the Elderly: An Empirical Analysis in Northern California

by Xinyu Cao, Patricia L. Mokhtarian and Susan Handy

The low mobility of seniors may be due in part to a history of auto-oriented transportation and land use policy decisions. More recently, land use policies that make it possible to drive less show promise of effectiveness for the population as a whole. However, little attention has been paid to the implications of such policies for older people. Using data collected from Northern California in 2003, this study explores the ability of neighborhood design to preserve accessibility for the elderly by enabling a shift from driving to transit and walking, controlling for confounding factors. The results show that overall, older people drive less and use alternative modes more often than younger people. After controlling for attitudes and socio-demographics, neighborhood design has limited effects on driving and transit use, but enhancing accessibility tends to be a promising strategy for promoting walking trips. This enhanced accessibility has a much larger effect on the elderly than on the younger. Therefore, neighborhood design seems to be an important aspect of sustaining the accessibility of older people.

read more

similar posts:

COLLECTING SOCIAL NETWORK DATA TO STUDY SOCIAL ACTIVITY-TRAVEL BEHAVIOUR: AN EGOCENTRIC APPROACH

THE FUTURE OF MOBILITY IN CITIES: CHALLENGES FOR URBAN MODELLING

Comparative Study of Pedestrian Travel Culture in Different Cities in Japan

How Urban Design Affect Personal Activity and Travel Choice - An Analysis of Travel Data from Sample Communities in Adelaide

Thursday, April 14, 2011

good things about bikes. and some less good.


A huge thanks to all of the volunteers working Saturday afternoon and into the evening. If you (faceless readers) haven’t yet been by to check out their space, please make an effort to do so. It’s open, well-lit, welcoming, and all of the volunteers who were helping out on Saturday afternoon were in good spirits (in spite of constantly being called to and fro).
Less awesome: The bike I was working on. I brought in an absolute clunker of a bike – an old Motobecane that had been sitting outside under the porch in Colorado for far too long and had then made the trip to California and spent most of its time sitting in our hallway. Less than awesome. There’s progress on the beast, and it was almost (briefly) rideable. But when I brought it home and inflated the tire a little more, I realized there was a slight issue. If the tire was inflated to the recommended psi (say, about 80), it bulged out seriously on the sidewall, so much so that it wouldn’t spin through the brakes. So I deflated the tire, tried to reseat the bead in the rim, then inflated the tire again.
 

more about Los Angeles:

Wednesday, March 16, 2011

The Costs and Financial Benefits of Green Buildings: A Report to California’s Sustainable Building Task Force

Principal Author: Greg Kats

Integrating “sustainable” or “green” building practices into the construction of state buildings is a solid financial investment. In the most comprehensive analysis of the financial costs and benefits of green building conducted to date, this report finds that a minimal upfront investment of about two percent of construction costs typically yields life cycle savings of over ten times the initial investment. For example, an initial upfront investment of up to $100,000 to incorporate green building features into a $5 million project would result in a savings of at least $1 million over the life of the building, assumed conservatively to be 20 years.1
The financial benefits of green buildings include lower energy, waste disposal, and water costs, lower environmental and emissions costs, lower operations and maintenance costs, and savings from increased productivity and health. These benefits range from being fairly predictable (energy, waste, and water savings) to relatively uncertain (productivity/health benefits). Energy and water savings can be predicted with reasonable precision, measured, and monitored over time. In contrast, productivity and health gains are much less precisely understood and far harder to predict with accuracy.
There is now a very large body of research, reviewed in this report, which demonstrates significant and causal correlation between improvements in building comfort and control measures, and worker health and productivity. However, these studies vary widely in specific measured correlations. Further, there has been relatively little work completed to evaluate specific, measurable benefits from green building design in California. Clearly, the benefits are significant and not zero, but the data supports a broad range of calculated benefits – in contrast to the more precisely measurable energy, water, and waste savings.
The financial benefits conclusions in this report should therefore be understood in this context. Energy, waste, and water savings as well as emissions reductions can be viewed as fairly precise, reasonably conservative estimates of direct benefits that alone significantly exceed the marginal cost of building green. Health and productivity benefits can be viewed as reasonably conservative estimates within a large range of uncertainty. Further research is necessary to better quantify and capture the precise savings associated with these benefits. Additional studies might include such measures as evaluating green building effects on insured and uninsured health effects, employee turnover, worker well being and, where relevant (e.g. in schools), test scores.


more about urban sustainability in California:

Reimagining a more livable San Gabriel Valley; dissecting national cycling death statistics

WALKABILITY, MOVEMENT AND SAFETY FOR THE CITY OF BERKELEY

SUSTAINABLE URBAN ENERGY PLANNING: A STRATEGIC APPROACH TO MEETING CLIMATE AND ENERGY GOALS

Tuesday, March 8, 2011

Reimagining a more livable San Gabriel Valley; dissecting national cycling death statistics


It’s a simple question, really.
Why should L.A. area cyclists give a damn about a freight transportation project — especially one that would follow the course of the San Gabriel River, the near-mythical waterway that flows well east of Downtown, where most Angelenos fear to tread?
The answer is equally simple.
Because it has the potential to dramatically transform transportation and livability of the east L.A. basin, bringing renewed life to communities currently choked by diesel fumes and roadways gridlocked with big rigs. And at the same time, restoring one of L.A.’s concrete-clad water disposal systems to the natural, free-flowing waterway it was before fears of flooding overwhelmed common sense and drove nature to its knees.
Oh, and it includes a bike path, too.
Rick Risemberg, of Bicycle Fixation fame, wrote me last week to call my attention to a proposed project I had been only vaguely aware of, and to which I hadn’t given more than a few moments thought.
GRID — the San Gabriel River Infrastructure Development project — would replace the current system of loading cargo at the Ports of Los Angeles and Long Beach with integrated cargo cranes that would load cargo containers directly onto electric trains, cutting offloading time from 36 hours to two. And at the same time, eliminating the need for thousands of semi-trucks that currently ply the ports and clog SoCal freeways.
The trains would then run through special bunker-strength tunnels placed under the banks of the San Gabriel River up to distribution yards in the Inland Empire, where the cargo would be transferred to trains and trucks for transport throughout the country.


photo by digablesoul
more bike-related posts:

BICYCLE DEVELOPMENT PLAN- City of Peoria, Arizona

Sights and details from the 2011 NJ Bike and Walk Summit

More Biking Lessons from Portland

Saturday, March 5, 2011

Tussle over SB 375 target for Southern California resolved, but funding challenges remain


...
There were strings attached to the Southern California targets.  Voting 29-21, the SCAG Regional Council had rejected these proposed targets on September 2, prior to their being adopted by ARB.  The Regional Council instead supported milder targets of -6 percent in 2020 and -8 percent in 2035, maintaining that targets any more ambitious than these would be appropriate only if several conditions were met.  But ARB, which had a September 30 deadline to meet, affirmed its commitment to the more ambitious targets of -8 and -13 percent proposed by agency staff.
That commitment was, however, accompanied by a compromise facilitated by Riverside Mayor Ron Loveridge, who sits on ARB.  SCAG capitulated on the -8 percent target for 2020, but final acceptance of the -13 percent target for 2035 was conditioned on the outcome of further discussion between ARB and SCAG.  The issue remained unresolved until recently.  What is interesting is not so much the fact that a resolution was reached, but the manner in which it was reached and how it reflects the challenges moving forward.


California to Reduce Carbon Emissions by...
Banning Black Cars?!, by Chuck “Caveman” Coker
more about urban sustainability:

Urban Design After Oil

TOWARDS A SUSTAINABLE URBAN TRANSPORT SYSTEM: PLANNING FOR NON-MOTORIZED VEHICLES IN CITIES

Neighbourhood planning and sustainability: mutually exclusive?

Tuesday, March 1, 2011

A Car Becomes a Weapon in Brazil; Pedestrians Shortchanged in Detroit

Motorist attack on Porto Alegre Critical Mass a grim reminder of the automobile’s destructive power: WalkBikeJersey comments on the shocking attack on a Critical Mass ride in Porto Alegre, Brazil. As Damien Newton at Streetsblog LA wrote yesterday, two people are in critical condition after a motorist plowed through a pack of cyclists on Friday. A total of 50 cyclists were struck. The incident was captured on video and WalkBikeJersey’s Andy B says the footage drives home the destructive force of cars: “The primary lesson that we should take from this tragedy is that there is little difference between the potential violence and carnage that can be perpetrated using an assault weapon or an automobile. This video is proof of that and it’s time that our laws acknowledge this reality.”


Tour de Fat, Los Angeles, by waltarrrrr

Tour de Fat, Los Angeles, by waltarrrrr

more posts about biking:

500 Kilometers of Bicycle Routes in Cicycling Capital of Germany

Cycling to Sustainability in Amsterdam

Cycle Traffic In Amsterdam Urban Planning